
How to Start Analyzing Organic Search Keywords
Analyzing your site traffic from search engines by the keywords your visitors used is a pretty important practice when determining your site's visibility online.
Unfortunately, many articles out on the internet address the long-tail keywords strategy, and assessing all of the keywords under your long-tail keywords strategy requires a huge amount of effort.
One way to help you start initiating such research is by categorizing the key terms and graphing them out.
Here is an example from a fictional blog site that generally writes about California.
The keywords listed in this chart would be hand-picked by your analyst based on key keywords that would be important to your site.
This chart tells me that 50% of all searched terms from search engines contained the word "Event."
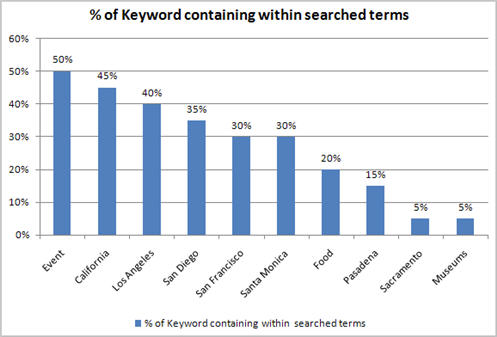
The data tells you that a lot of the search traffic comes from event-related times. "Event" related searches happen more than "Museum" or "Food" related terms.
This observation is good intel, and it is nice to know because it also tells you how you positioned the site's content. The opportunity for this site would be to write more relevant content about food and museums.
That new goal you set will allow you to plan what content to write and re-position your site.
Thank you so much for taking the time to read my content. If you've liked what I've had to say please subscribe!

ZoomMetrix Newsletter
Join the newsletter to receive the latest updates in your inbox.