
Finding Customer Pain Points on your Website
One of the common questions optimization (CRO) experts get is, how do you find customer pain points on your website so that they could be fixed or tested to improve site experience?
The common answer you may get back is finding customers’ pain points on the website and then fixing it by using an analytics tool like Google Analytics, Site Catalyst, Webtrends, etc. However, the art of finding the customer’s pain points is usually deeper than what you may expect. Here are some ideas, but I would love to hear from you if you have any.
Look deeper into error page visitors.
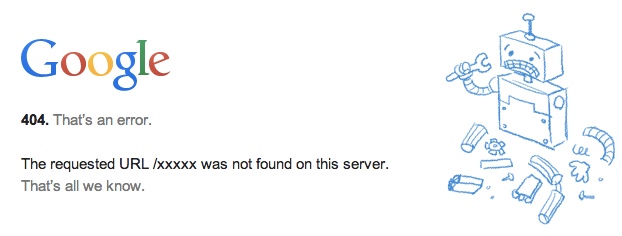
The 404 Error Page is something all brands should worry about. There is an unavoidable situation like when I entered some random URL in Google search, which gives me the following result.
However, if your visitors are hitting this page through an existing link on your production site, or your marketing campaign is driving to a 404 page, then that could be a super lame experience for the people visiting your website.
Things to consider in reviewing your error page visitors are by taking a deeper look (or segmenting) the 404 visitors:
- What URLs do people use to arrive at 404
- What traffic sources are leading to this error page
- What landing page is driving traffic to this error page? Not all people land on the 404 page directly. It could be a particular page with an expired link. Could be many other things.
- Details around the technical environment. Does browser, device type, OS, time of day 404 error page increase?
Use VOC and segment data on people who could not Task Complete.
What website owners think as an error or failure point may differ from how customers see it.
If you have some survey or feedback capture mechanism on your site, you might want to cater to questions that could help you understand customer pain points.
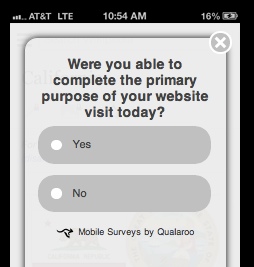
Usually, the survey tool allows you to serve the survey on any page you want, or if you have it done across many pages, the data export gives the URL where visitors took the survey.
So in this example, you might be able to find pages with high responses from people who said ‘No’ to ‘Were you able to find the information you were looking for?’.
So now you have a good starting point for formulating a good hypothesis on why a particular page sucks and what needs to get optimized.
One of my favorite analysis and observation points is Clicktale and iPerceptions integration, where I get to see session recordings of people who left negative feedback.
For example, survey respondents to the iPerceptions survey rated the site experience at 0 (0 out of 10, 10 being great); Clicktale will allow you to see user behavior from those who rated 0 on the customer satisfaction survey.
You may find something interesting about the site that you did not know.
How awesome is that, to be able to understand what the customer exactly went through?
Drop off between form submits
It is very common to tackle optimizing some behavior funnel or form submission funnel to reduce people dropping off in a certain step and, for example, increasing the shopping cart closure rate.
I don’t hear much from this type of analysis is; what if people click on that last ‘Submit’ button, but the data did not go through?
In the eCommerce example, it is that situation when you’ve reviewed all the information you put in and are ready to checkout, the site freezes, or you hit that final ‘confirmation’ button but not sure if you’ve hit the thank you page.
This is quite different from page to page drop-off because the user’s intent to close the sale is ‘real,’ not one of those fuzzy last-minute changes of decision.
This is a good point to check your data because you can use your analytics tool to track such drop-offs. It is pretty common in the CRO world to optimize websites from the bottom of the funnel, likely to generate quick great CRO results.
Site speed or loading time
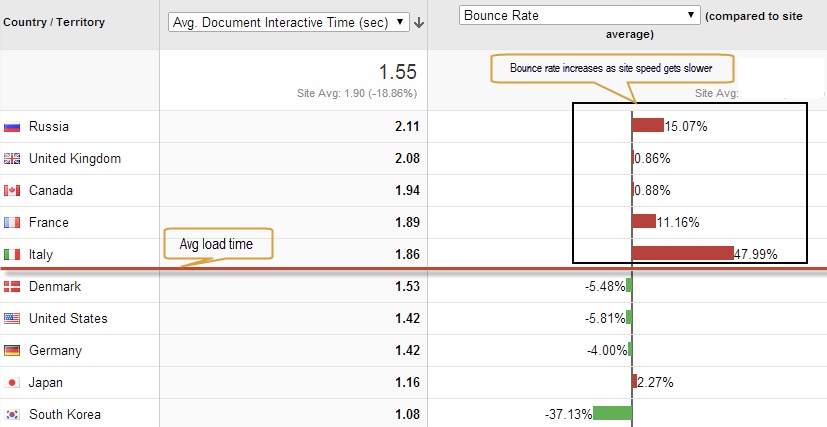
It shouldn’t surprise that the faster the site serves content to users, the lower the bounce rate, or maybe even the site conversions.
Here is an example of average document interactive time (DOM readiness) versus bounce rate. You’ll see causation between the speed and bounces.
Of course, there are things you can’t do much as a brand, such as improving one country’s network infrastructure.
But most brands should control common technical stuff on the site, ranging from minimizing code and reducing the image assets' weight.
Monitoring your site’s performance and constantly thinking about avoiding customers having to wait for the content is something to optimize.
Assessing this data per site section, by platform, or page level could give you a better perspective of where customers feel the pain.
Top landing page with high bounce rate
Usually, this is the first thing most analysts look at to understand which landing pages are the popular entry point for the site visitors but have high bounces.
Typically, most analysts would dig deeper into potentially the problematic page. Common data to dig deeper to understand the drivers of the high bounces are:
- Traffic sources that are driving traffic and high bounces.
- Device type. Is it mobile or tablets that are driving high bounce?
- Timing. Could it be due to some timing with the press release, product announcements, promotional discounts?
- Country and network speed. Like some emerging countries with expected slow network speed may have high bounces.
- The specific segment that bounces. You may have different segments built out in your analytics tool based on a combination of things that defines some group. For example, support users from those who purchased before and came back to the support page, campaign ad visitors who have returned to the site for the 3rd time, returning visitors who came from email.
- Technical environment. Like browser and the version of the browser. Don’t be surprised if you get a few particular browsers on a certain version that gets high bounces. Talking with a web engineer may help you understand why certain browsers can lead to a higher bounce rate.
In summary, you can do so many things with your analytics tool, survey tool, and Heatmap tool to understand customer pain points.
It is not just about finding out what is working and obsessing about improving conversion rates.
In many situations, it is important to think of the inverse scenario. Like looking at data on those who did not convert, asking and finding what’s broken, a collection of pages not adding value, error page visits, and why people visit that page.
These are unsexy things that marketers/analysts should be thinking about that could help build a better understanding of customer pain points so that you can build a great hypothesis to test/experiment or fix the website immediately.
Thank you so much for taking the time to read my content. If you've liked what I've had to say please subscribe!


ZoomMetrix Newsletter
Join the newsletter to receive the latest updates in your inbox.