
Definitions of Your Must-Have KPIs in Google Analytics
I will cover Google Analytics KPIs that most marketers may refer to from the tool to make better business decisions.
For those who don't know what KPI means, KPI means key performance indicators. They are defined as business metrics (units of measure) that enable your organization to define, evaluate and analyze its progress towards organizational goals.
KPIs do possess a signifying place in web analytics. Each website is created with certain objectives within the given period.
KPIs provide detailed data on the nature of our progress towards achieving the organization's objectives. In addition, it will help us re-establish our goals according to the analytics report of the KPIs.
It depends upon the nature of your site to select the significant KPIs. However, the basic KPIs in Google Analytics are covered in detail here.
It is important to note that the KPIs for a particular website may not work for another website.
The number of visits
Website visits are the number of sessions on a site over a specific period. Most people analyses this KPI regularly. The best practice is to set a target for this KPI, say, for over a period of one month.
Try improving your marketing strategy to achieve your targeted web traffic for a fixed period. This KPI is related to web traffic, and the majority of the web business is much concerned about its value.
It would help if you gave your top talent to increase the value of this KPI to meet your targets. Give more attention to the trends in the visitor numbers about your targets.
This KPI is related to web traffic, and the majority of the web business is much concerned about its value. Therefore, it would help if you gave your top talent to increase the value of this KPI to meet your targets. Also, give more attention to the trends in the visitor numbers about your targets.
Pageviews
Pageviews are the total number of pages viewed on your site and are a general measure of how much your site is used. It is more useful as a basic indicator of the traffic load on your site and server rather than as a marketing measure. A website that sells ads based on impressions usually cares about page views more than anything else.
Absolute Unique Visitors
"Absolute Unique Visitors" is how many visitors (people) came to your site, counting each person only once for the entire period. Google Analytics seems to use IP address + User-Agent + First Party Cookies to identify a visitor. A unique visitor is an ultimate measure to reflect the number of people that visited your site.
Bounce rate
Bounce Rate is the percentage of single-page visits (i.e., visits in which the person left your site from the entrance page).
Bounce Rate is a measure of visit quality, and a high Bounce Rate generally indicates that site entrance (landing) pages aren't relevant to your visitors.
Landing pages should provide the information and services described in the ad copy or even address visitors' needs. So that even if they leave, they can re-visit to your website and ultimately convert.
A high bounce rate means that the attributes of your site did not attract the visitor, and visitors retracted their steps. The satisfaction of visitors is what matters here most. The main reason for this phenomenon is inappropriate content according to their taste on the landing page, unalluring design, and technical problems.
It is clear from the above description that a lower bounce rate indicates the success of your online marketing strategies.
Your website is functioning in the best possible way according to your best efforts. Try to analyze the data of the bounce rate based on the trends in a given period.
A point to be noted here is that a higher bounce rate does not always show poor website performance. For example, in the case of blogs, a visitor may be directed to your website to read only a particular article on a specific page, get what they need, and leave.
Time on site
Time on site is one way of measuring visit quality. If visitors spend a long time visiting your site, they may be interacting extensively with it. However, Time on Site can be misleading because visitors often leave browser windows open when they are not viewing or using your site.
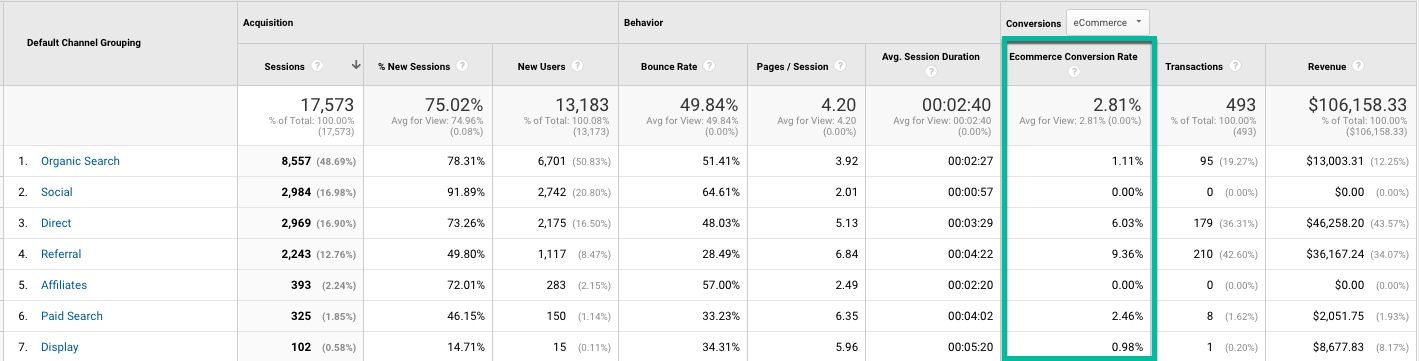
Conversion rate
For a none e-commerce site, Conversion Rate is the primary metric for assessing how well marketing, the website, and content work together to achieve business objectives.
Conversion Rate is the percentage of visits that result in the visitor taking an action that you have defined as important to your business.
Every website is created with a pre-defined goal. It may be of various natures, such as contacting the organization, filling in a registration form, or purchasing a product.
Conversion rate is an effective KPI that helps monitor the website's goals. It is the rate at which the visitors take your goals or positive measures. If you have a high conversion rate, it indicates that you have made a considerable number of customers act according to your wishes on your website.
To maintain a high conversion rate, your site should have the perfect mix of quality web traffic and excellently worked customer experience or the right product offerings as a business.
The conversion rate KPI extracts the best value of such good measures. Google Analytics provides you with enormous stats of all the factors that affect the conversion rate. So if you improve your customer experience, your conversion rate will improve.
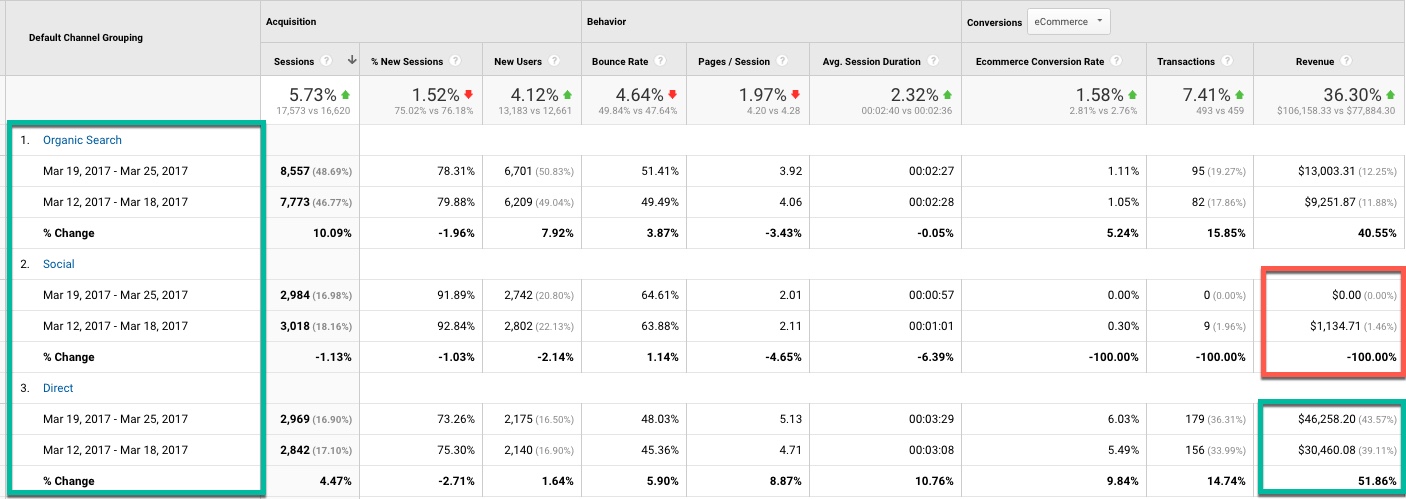
Revenue and Traffic volume by sources
Google Analytics traffic sources report provides an overview of the different sources that send traffic to your site.
The graph shows traffic trends; the pie-chart and tables show the traffic sources driving the directions.
For example, “Direct Traffic” visits from people who clicked a bookmark to come to your site or who typed your site URL directly into their browser. “Referring Sites” shows visits from people who clicked to your website from another website.
Finally, “Search Engines” shows visits from people who clicked to your site from a search engine result page.
Now, search engines marketing is on the top list of online marketing. Most organizations try hard to move up the search engine rankings for better web traffic.
This KPI will analyze the nature of the sources from which your web traffic has arrived on your sites. Depending entirely on search engines is a risky thing.
If we rely on search engines for 90% of web traffic, then think about the day, suppose, when Google modified their algorithm or removed your company from their database.
This will put a sudden stop to your major revenue share. Therefore, it is better to increase your traffic from all sources, including the small traffic sources over time. It will help you to stand in the long run.
Make sure that your Google Analytics report of traffic sources should not show any source of traffic dominating for a long period unless it is part of your strategies.
Keywords data shows the keywords used in the search that referred traffic to the site. Additionally, Google Analytics can segment the keywords by paid, non-paid (organic), and overall. Carefully monitor how your added or changed content affects the keywords searched over some time.
For E-commerce
Google Analytics is great for tracking e-commerce transactions. There are various KPIs under the e-commerce report, and it will help you measure your site’s success to your revenue and sales over time.
Some KPIs under e-commerce are:
Total Revenue
Revenue is determined by the number of purchases and the average purchase value. Some important steps you can take to maximize revenue are:
- Purchase targeted advertising and write effective ads (see the Traffic Sources reports)
- Make sure your landing pages show the information, services, or products that you promise in your ads (review the Content reports to help minimize bounce rates)
- Simplify your conversion funnels so that fewer would-be customers abandon the checkout process (review the Goals reports)
Conversion Rate
This report shows the rate at which visits to your site result in purchases. Tracking conversion rates over time effectively determines whether your marketing and website are becoming more or less efficient at turning visitors into customers. In addition, conversion rates are most useful as company-specific benchmarks against which to assess marketing and site effectiveness because conversion rates vary considerably across businesses (even within the same industry).
Average Order Value
Tracking changes to the average order value over time is important to catalog sites that may change and shift which products and services they are actively marketing. Many e-commerce sites monitor this metric to see if cross-promotions are working. This important metric works its way into many higher-level executives and shareholder reports.
Product Overview (Product Performance)
How much of each product do you sell? This report shows the number of items sold, the total revenue, the average price, and the average order quantity for each product you sell online. Click any SKU to drill down and view detail.
Product SKUs (Product Performance)
This report shows the number of items for each SKU sold, the total revenue, the average price, and the average order quantity for each product you sell online.
Categories (Product Performance)
How much of each product category, product, and SKU do you sell? For e-commerce sites, understanding which products are selling online is crucial for generating relevant content, promotions, and advertisements. This report shows the number of items sold, the total revenue, the average price, and the average order quantity for each product you sell online.
Transactions
This report lists all transactions on your site, which is useful for auditing your transactions.
Visits to Purchase
How many visits does it take for visitors to purchase? Understanding your sales cycle is important to the overall success of your site. This report helps you know how many visits it takes to convert your visitors into customers and, by extension, the kind of content you need to create to reach your prospects.
Time to Purchase
How long does it take before visitors make a purchase? Understanding your sales cycle is important to the overall success of your site. This report helps you know how long it takes to convert your visitors into customers and, by extension, the kind of content you need to create to reach your prospects.
KPIs are a revelation in that they inform us about our success or failures in our path to achieve the objectives.
KPIs are the main criteria for determining the website activity and help us take the necessary steps to boost the online marketing initiatives.
I hope you acquired a better understanding of these KPIs from Google Analytics to make your site better and successful.
Reference: Google – http://www.google.com/support/analytics/
Thank you so much for taking the time to read my content. If you've liked what I've had to say please subscribe!

ZoomMetrix Newsletter
Join the newsletter to receive the latest updates in your inbox.